Find the Best Moments in a Twitch VOD with Chat Activity
The hardest part of editing a Twitch VOD isn’t the cuts — it’s finding the moments worth cutting in 4 hours of footage. Chat activity is the cheapest signal you have. When viewers are reacting, the chat scroll speeds up; when nothing’s happening, it slows. A messages-per-second graph turns a 4-hour scrub into 8–12 timestamps to review. This guide explains the theory, the manual techniques, and the tools that automate it.
Why chat is a reliable signal
Viewers aren’t typing because they’re bored — they’re typing because something just happened. A clutch play, a funny moment, a fight in chat, a chair clip, a jump-scare. The behavior is reactive, near-instantaneous, and in aggregate it’s hard to fake. Compared to audio analysis (which can be fooled by ambient music or a streamer’s natural volume) or video analysis (which often misses skill-based highlights), chat is the closest thing to a crowdsourced “this matters” vote you can get.
There’s a threshold below which the signal breaks down. Above roughly 50–75 concurrent viewers — a rough industry consensus reflected in writeups from Stream Crops and the Koala research community — the noise floor smooths out and chat spikes become reliably predictive of highlight moments. Below that threshold, chat is too sparse to trust statistically: a single excited regular can look like a “spike” that isn’t one. For small streams, you fall back to manual techniques (covered later in this guide).
The other thing chat catches that algorithms struggle with: in-jokes and community memes. The graph doesn’t know why 200 people just spammed pepeLaugh — but it tells you they did, and that’s enough to pull the timestamp.
What a chat-activity graph looks like
The visualization is simple. X-axis is the VOD timestamp from 0:00:00 to the end of stream. Y-axis is messages-per-second (or per-minute, depending on resolution and stream length). What you’ll see is a smooth, slow baseline — the steady hum of background chat — punctuated by sharp vertical spikes where activity multiplied 5–20x for a few seconds. Those spikes are your candidate highlights. The 5–10 tallest are the obvious ones; another 5–10 mid-range spikes are usually worth a look.
A 4-hour stream with healthy engagement typically produces 8–15 spikes worth reviewing. Less than that and either the stream was quiet or the buckets are too coarse — try 15-second buckets instead of 60-second.
The refinement that turns a good signal into a great one is emote filtering. Different emotes correlate with different emotions:
- Laughing emotes (KEKW, OMEGALUL, LULW, pepeLaugh) cluster around funny moments.
- Hype / “Pog” emotes (PogChamp, POGGERS, EZ Clap, PogU) cluster around skill plays and clutch moments.
- Scared / sympathy emotes (Sadge, monkaS, FeelsBadMan, peepoSad) cluster around horror games, fails, and emotional beats.
Filter chat down to a single emote class and the entire graph reshapes around that emotion. Want only the funny moments? Filter to the laugh family. Want only the hype clutches? Filter to the Pog family. This is how a generic “chat is loud” signal becomes a “chat is loud about this kind of thing” signal.
Tools that show the graph
A handful of tools expose the chat-activity graph directly. They differ on price, polish, and how much of the editing workflow lives in the same window.
Stream Crops (free, web): paste a VOD URL, get a chart with peak markers. Simple, reliable, and free for community use. Good first stop if you’ve never seen what your own VOD’s chat graph looks like.
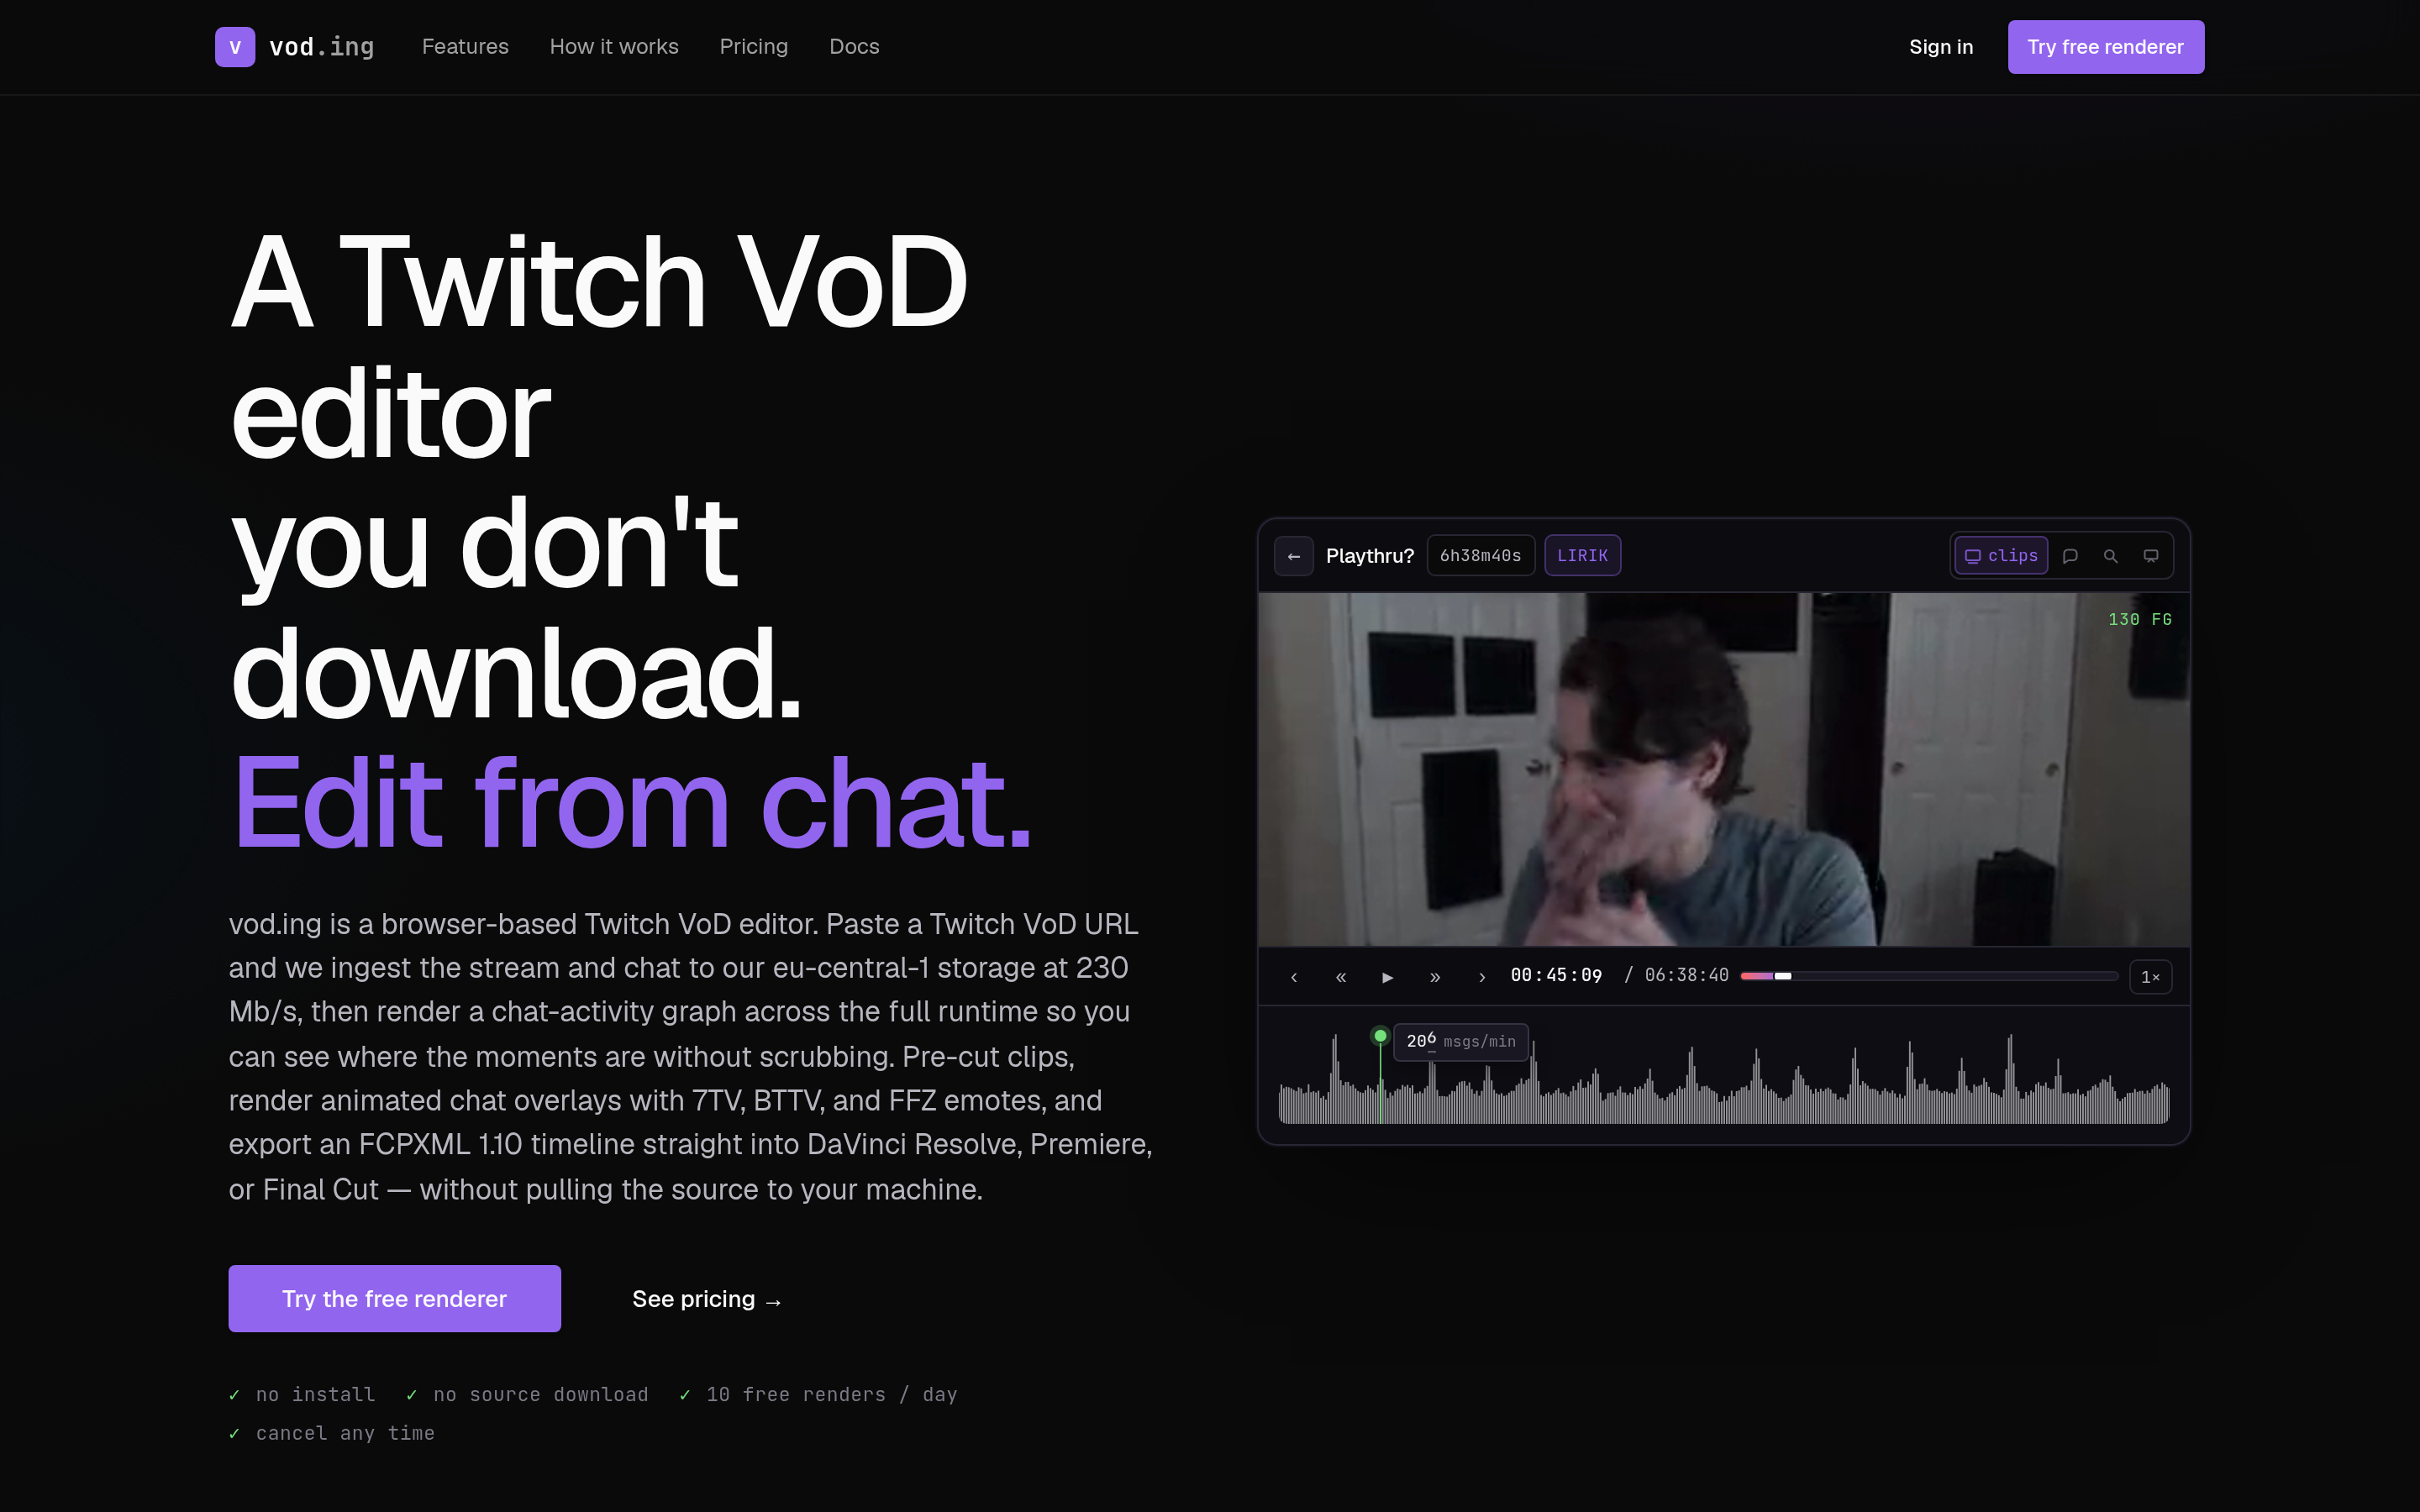
vod.ing (paid): full chat activity graph with emote-class filters, draggable selection on the timeline to create clips, and an in-browser preview so you never leave the page. The most polished implementation of the workflow this article describes — graph, filter, scrub, clip, export, all in one tab.
Koala VOD (free with paid tier): chat-activity heatmap focused specifically on highlight discovery. Good free tier; clean UI.
TwitchDownloader chat JSON (free): if you want to roll your own analysis, download chat as JSON and write a 30-line Python script to bucket timestamps and graph in matplotlib. Useful for editors who want full control — weighting by VIP/sub messages, filtering specific users, applying their own thresholds.
Eklipse / StreamLadder auto-detection (paid tier): doesn’t expose the raw graph but uses chat density (plus video/audio analysis) to auto-clip. Useful when you want output, not visibility into the signal. The tradeoff: you lose the ability to second-guess why a moment was picked.
For a fuller breakdown of editor software including these tools, see the best Twitch VOD editing software in 2026.
Manual technique: noting timestamps as you watch
When chat is too sparse for the graph (under about 50 concurrent viewers), the best signal is a human one. Either you (or a paid mod / a regular lurker who agreed to help) drops timestamps in the streamer’s Discord during the live broadcast:
[1:23:45 - clutch ace, 1v3 retake]
[2:14:08 - funny chair clip — knocked over the desk mic]
[3:01:22 - tilting at chess.com after losing on time]
This is the highest-quality signal because a human noted it intentionally, with context. No algorithm has to guess what just happened — the timestamp comes with a one-line description that doubles as a draft caption.
For small streams, this is the primary technique; chat-activity graphs add little signal at that volume. Many growing streamers formalize it: a single regular volunteers as the “clip-noter” in exchange for a sub or a VIP badge, and the editor’s job becomes assembling the noted moments rather than discovering them. The economics are absurdly good — five minutes of typing during the stream saves three hours of scrubbing afterward.
Manual technique: scrubbing intros, transitions, peak chat
Even with the graph, you’ll scrub three categories of moments the graph alone doesn’t catch:
- Intros and outros — usually skippable, but check for any “today I’m announcing” or “before we start” content. Streamers often bury news here.
- Game / activity transitions — the moment a streamer switches games or activities is often where they react, lose their composure, or set up the next 30 minutes of content. Chat tends to be quiet here (everyone’s watching the loading screen) so the graph misses it.
- Quiet moments with skilled play — competitive games sometimes produce highlights with low chat reaction (the chat doesn’t realize the play was technically good). Cross-reference the graph against in-game events you know matter: round wins, level-ups, kill streaks.
The 80/20 here is: trust the graph for 80% of clips, scrub manually for the 20% the graph can’t see.
Combining signals
The strongest workflow uses two signals overlaid:
- Chat-activity graph for the obvious moments — laughs, fails, clutch plays where chat noticed.
- Audio peaks for moments where the streamer reacted strongly but chat was slow. Most chats have only 1–5% of concurrent viewers actually typing; the other 95% are lurking. A scream, a laugh, or a sudden silence from the streamer often catches what chat missed.
In the editor, scrub waveform peaks alongside chat-activity peaks. Where both spike at the same timestamp, you have very-high-confidence highlight candidates — those are the clips you don’t even need to preview, just trim and export. Where only one signal spikes, preview before clipping.
This dual-signal approach is also what most paid auto-clippers do under the hood, just without showing you the components. Doing it manually with a graph plus your editor’s waveform gives you a sanity check on what the algorithm would have picked.
What chat activity misses
Be honest about the limits. Chat spikes look like highlights, but some of them aren’t:
- Coordinated raids / hate brigades look like spikes but aren’t usable highlights.
- Sub trains spike chat but the moment itself isn’t usually clip-worthy — it’s just the bot announcing 12 gift subs.
- Scripted bot messages (giveaway bots, sub-thanks bots, command spam) inflate the baseline and create false peaks. Filter them out by username if your tool allows.
- Sub-only or VIP-only conversations won’t appear in your public chat data at all if the channel toggled mode mid-stream.
- Lag spikes / stream drops sometimes spike chat with confusion (
?,buffering for anyone else?,F).
For small streams, all of these matter more because the noise:signal ratio is worse — a single bot can dominate a 30-viewer chat. Filter aggressively when the channel is small.
Building your own analysis (advanced, optional)
For editors who want full control, the DIY path is short. Download the chat as JSON using TwitchDownloader’s CLI:
TwitchDownloaderCLI chatdownload --id VOD_ID -o chat.json(See the complete VOD download guide for the full TwitchDownloader walkthrough, including authentication for sub-only VODs.)
Then parse it with Python:
import json
from collections import defaultdict

data = json.load(open("chat.json"))
buckets = defaultdict(int)

for msg in data["comments"]:
    sec = int(msg["content_offset_seconds"])
    buckets[sec // 30] += 1  # 30-second buckets

top = sorted(buckets.items(), key=lambda x: -x[1])[:15]
for bucket, count in sorted(top):
    timestamp = bucket * 30
    h, m, s = timestamp // 3600, (timestamp % 3600) // 60, timestamp % 60
    print(f"{h:02d}:{m:02d}:{s:02d}  ({count} msgs)")
That’s it — about 15 lines including the formatting. The output is your top-15 highlight candidate timestamps, ready to paste into your editor’s seek bar. Extend it however you want: weight subs at 2x, filter by emote substring, exclude known bot usernames, dump to CSV, plot in matplotlib. The TwitchDownloader chat JSON includes user badges, emote IDs, message colors, and timestamps — everything you need to build whatever signal matters to you.
If you’re cutting these clips for short-form output afterward, the TikTok / Shorts / Reels conversion guide covers how to take those timestamps the rest of the way.
The 80/20 of moment-finding
For most editors, the workflow is:
- Get the chat-activity graph from a tool (Stream Crops, vod.ing, Koala, or your own script).
- Review the top 8–12 spikes — open the VOD at each timestamp, watch 30 seconds before and 30 seconds after.
- Keep 4–6 of those as actual clips after watching the surrounding context.
Remaining time goes into editing those 4–6 clips well — captions, zooms, hook framing, export to vertical. Spending 4 hours scrubbing instead of 30 minutes reviewing peaks is the highest-ROI workflow change a Twitch editor can make. The graph isn’t perfect, but it gets you to “candidate list” 8x faster than scrubbing, and the candidate list is where the real editing work begins.
For more highlight-discovery techniques, including audio-based detection and pacing strategy, see the find-stream-highlights hub.
FAQ
What’s the best free tool for finding highlights in a Twitch VOD? Stream Crops is the easiest free option — paste a VOD URL, get a chat-activity chart with peak markers, no signup required. Koala VOD’s free tier is also strong. If you want full control, download chat with TwitchDownloader and write a 15-line Python script to bucket timestamps yourself.
Does chat-activity analysis work for small streams? Below ~50 concurrent viewers, chat is too sparse to trust statistically — a single excited regular can look like a spike. For small streams, the better technique is having a mod or regular drop intentional timestamps in Discord during the live broadcast. Five minutes of typing during the stream saves hours of scrubbing later.
Can chat activity tell which moments are funny vs which are clutch plays? Yes, by filtering the graph by emote class. Laughing emotes (KEKW, OMEGALUL, pepeLaugh) cluster around funny moments; “Pog” emotes (PogChamp, POGGERS, EZ Clap) cluster around skill and clutch moments; scared emotes (Sadge, monkaS) cluster around horror or fails. Tools like vod.ing expose this filter directly; with a DIY script you filter by emote ID in the chat JSON.
How accurate are auto-clippers like Eklipse and StreamLadder compared to manual chat analysis? Auto-clippers usually get the obvious 60–70% right (the moments anyone would have caught) but miss subtle wins and false-positive on sub trains and bot spam. Manual chat-graph review catches roughly 85–90% of the genuinely good moments because you can second-guess the signal. For volume output, auto-clippers win; for quality output, the graph + manual review wins.
Can I find highlights without downloading the VOD? Yes. Tools like Stream Crops, Koala VOD, and vod.ing pull chat data directly from Twitch’s API using just the VOD URL — no download required. You only need to download the VOD itself when you’re ready to actually cut clips, and even then some browser-based editors stream it without a local download.
Audio analysis vs chat analysis — which is better? Use both. Chat catches moments where viewers reacted (often funny or shared-context wins); audio catches moments where the streamer reacted (often clutch plays or scares that chat was too slow for). Where both signals spike at the same timestamp, you have a near-certain highlight. Where only one spikes, preview before clipping.